Full Ports, Weak Prices: China's Iron Ore Stockpiles in Autumn 2026 and What Buyers Can Read from Them
Iron ore stocks at Chinese ports are rising, the price has fallen to a multi-year low, and meaningful volumes are arriving from Guinea for the first time. Why port stockpiles have become the key leading indicator this autumn.
The month-end numbers
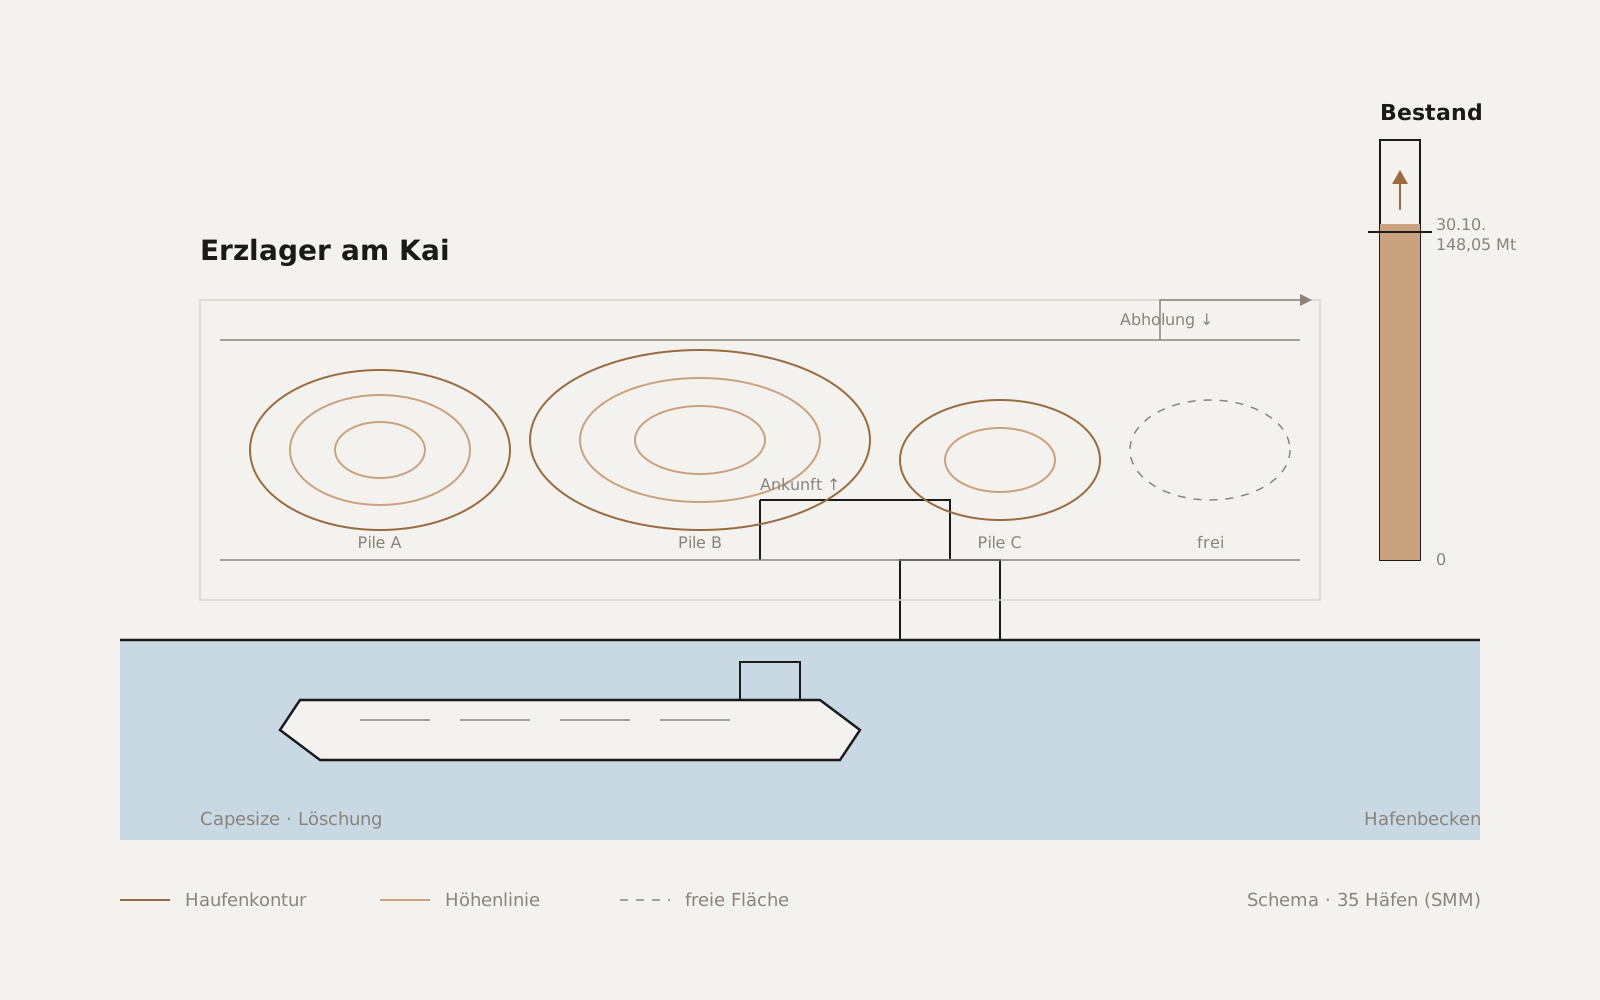
As of 30 October 2026, iron ore inventories at China's 35 main ports stood at around 148.05 million tonnes according to Shanghai Metals Market (SMM), roughly 0.3 million tonnes more than a month earlier. Daily average port pick-up volume edged down by 35,000 tonnes to 3.175 million tonnes. SMM reports a notable rise in port arrivals in the final week of October alongside a decline in hot metal output from blast furnaces, and expects inventories to keep accumulating in the short term.
Mysteel, which tracks a wider sample of 47 ports, had already reported a fourth consecutive weekly increase in early October: 173.2 million tonnes as of 8 October, 15.7 percent higher than a year earlier. The two series are not directly comparable because of the different port samples, but they point in the same direction.
The price has responded accordingly. On 15 October, iron ore futures on the Singapore Exchange fell to $89.75 per tonne, the first time at that level since September 2024. Bloomberg reported on 30 October that the price was heading for its lowest month-end close since October 2022, citing ample global supply and elevated Chinese port stockpiles. By Macquarie's calculation, the price has fallen around 24 percent from its peak in May.
Guinea is changing the routes
The supply side has a new element this year. The first commercial cargo from the Simandou project in Guinea reached Majishan port in Zhejiang province in January 2026, nearly 200,000 tonnes of high-grade ore at around 65 percent iron content. The ramp-up has continued since. According to Macquarie, Guinea exported 8.9 million tonnes of iron ore in the third quarter, up from 6 million tonnes in the previous quarter; if October shipments hold their pace, the full year could reach around 28 million tonnes.
For shipping, this means longer voyages. Analysts expect Guinean ore to gradually replace part of the shorter Australian routes over the medium term, raising tonne-miles in the Capesize segment. The Baltic Dry Index swung accordingly in October: on 21 October the Capesize index jumped 7.7 percent to 3,793 points, and the headline index closed the month on 30 October at 2,714 points. Daily Capesize earnings in October ranged between roughly $30,000 and $37,000 depending on the report.
Why port stockpiles are the decisive indicator
For procurement and logistics managers at steel mills, traders and suppliers, this autumn is a case study. Three quantities are moving at once. Port arrivals are rising because new volumes from West Africa coincide with ample supply from Australia and Brazil. Pick-up from the ports is falling because blast furnaces are producing less hot metal. And the price is responding to the difference between the two, which builds up physically in the port stockyards.
Port stockpiles are therefore the place where supply and demand visibly meet. Whoever sees them early and reliably spots the turn before the price does. The problem is that the published series appear weekly, rest on different samples and become available with a lag. Mysteel counts 47 ports, SMM 35; the gap of roughly 25 million tonnes between the two series is not a measurement error but a matter of definition.
What can be checked independently
This is exactly where remote sensing comes in. The large ore stockyards on the quays of Qingdao, Rizhao, Caofeidian or Majishan are clearly visible from orbit: piles with sharp outlines on paved ground, whose footprint and height can be estimated from optical stereo and time-series imagery. Footprint and height give a volume; volume and bulk density give a tonnage. The method is not accurate to the tonne, but it is consistent, repeatable and independent of any data provider's sample.
For a single port, it becomes possible to check whether the reported build-up is actually happening where one's own material sits, and whether pick-up at particular quays is running faster or slower than average. Combined with vessel AIS data, it also shows when arrivals from Guinea, Australia or Brazil actually land and how long ships wait off the port.
In practice
For a procurement team, this is not about replacing market reports but about checking them. Tracking inventories at the relevant ports weekly from satellite data gives a second, independent view of the same question SMM and Mysteel answer, and makes it possible to spot divergences between reports and reality early. In a market where the price has lost a quarter of its value within five months, that is a difference that shows up in the timing of purchases.
Sources
- SMM: Iron Ore Port Inventory and Port Pick-up Volume on October 30, 2026
- Hellenic Shipping News: China Iron Ore Port Inventory and Port Pick-up Volume on October 30, 2026
- SMM: Iron Ore Port Inventory and Port Pick-up Volume on October 16, 2026
- Mysteel: WEEKLY – China's iron ore port stocks rise further over holiday
- Bloomberg: Iron Ore Heads for Lowest Month-End Close Since October 2022 (30 Oct 2026)
- IndexBox: Iron Ore Prices Fall Below $90/t in Late October 2026
- IndexBox: Simandou Iron-Ore Ramp-Up Offsets Global Supply Cuts, Macquarie Says
- Breakwave Advisors: Iron Ore Outlook – Simandou Supply, China Demand and Freight Trends
- IndexBox: Dry Bulk Freight Rates October 2026 – Capesize Volatility
- Baird Maritime: Capesize strength drives Baltic dry bulk index rebound to weekly high
- Hellenic Shipping News: Dry Bulk Market