Heat Summer 2026: What the DWD Balance and the RKI Figures Mean for Municipalities
The DWD takes stock of one of the warmest and driest summers since 1881, while the RKI estimates around 14,000 heat-related deaths by early August. What climate and public-health departments can take from this summer for their heat-action plans.
The German Weather Service's balance
On 31 August 2026, the German Weather Service (DWD) published its preliminary balance for summer 2026. It was one of the warmest summers since nationwide records began in 1881 and at the same time one of the five driest; the DWD describes the summer as clearly too dry across the country. With around 779 hours of sunshine, the summer also ranks among the five sunniest since 1951. Media reports citing the DWD put the deviation at 3.3 degrees against the 1961–1990 reference period and rank it as the second-warmest summer on record. All values are preliminary.
August alone, according to the DWD's monthly report, had a national mean of 19.9 degrees, 3.4 degrees above the 1961–1990 average. The first half of August brought persistent heat, especially in the south and south-west, where more than ten hot days of at least 30 degrees were widely recorded. The final third of the month was cooler; severe thunderstorms and several tornadoes hit Brandenburg and a belt from Rhineland-Palatinate through Hesse to Thuringia.
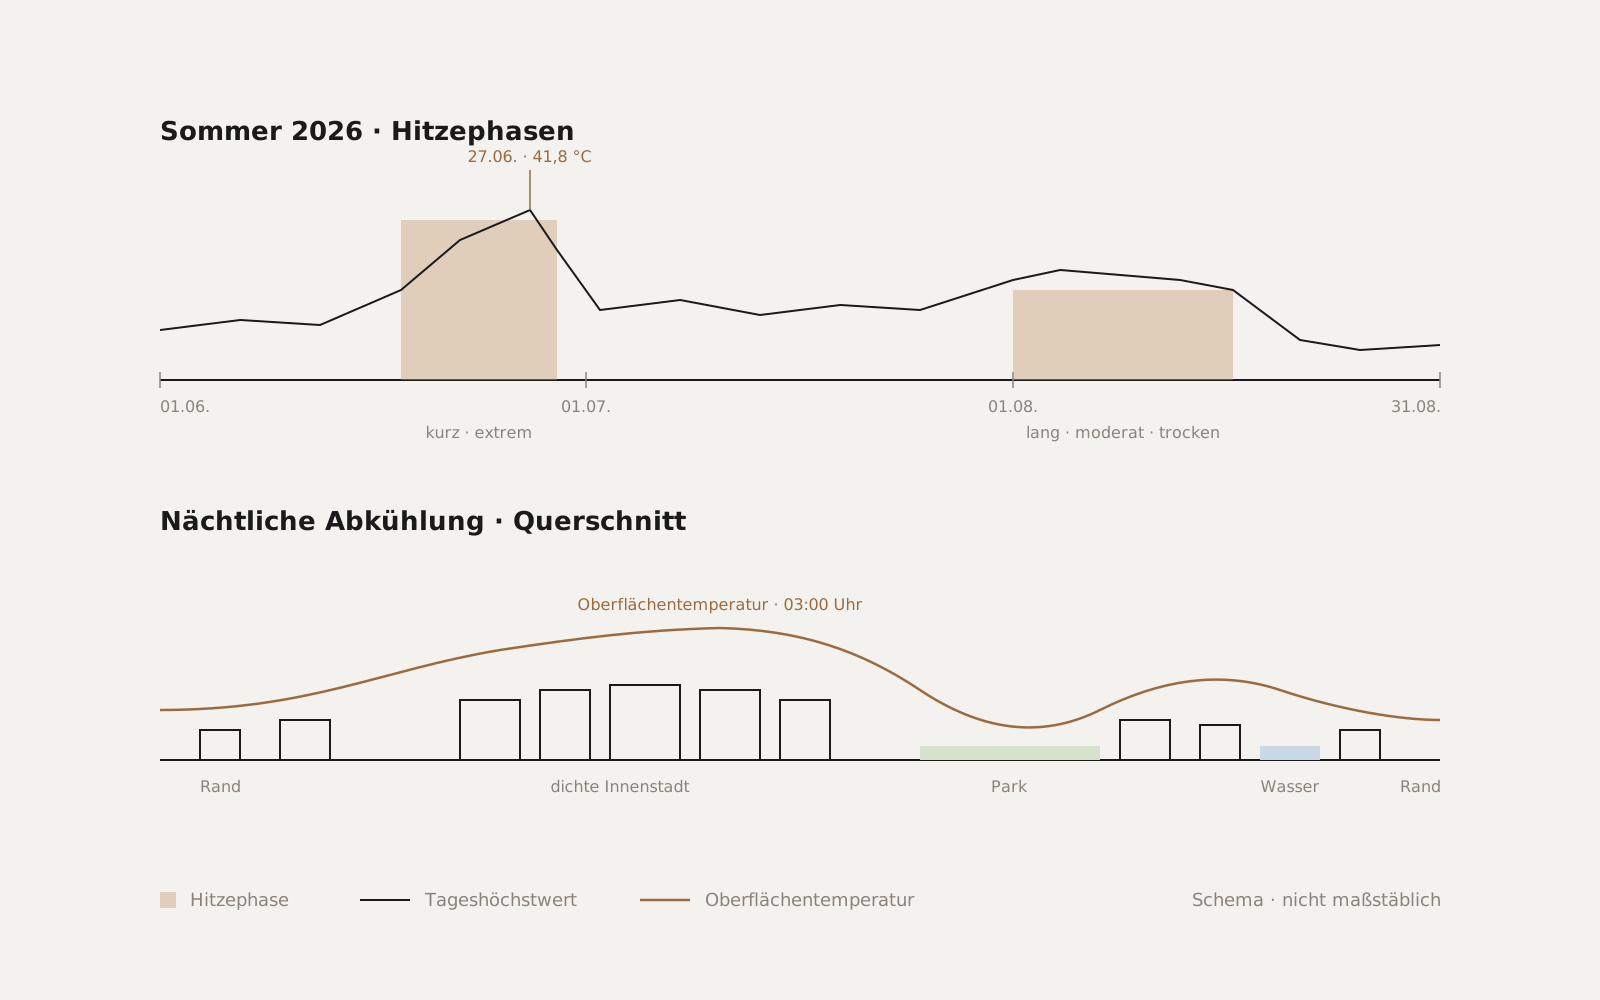
The peak of the summer, however, came not in August but at the end of June. From 18 June, Germany sat under a heat dome for eleven days; on 27 June, according to reports on the DWD data, a new German all-time record of 41.8 degrees was measured, and records fell at 467 of 488 stations.
What the RKI counts
The Robert Koch Institute estimates heat-related deaths not from death certificates but from statistical excess mortality in weeks with high temperatures. According to its weekly report in early August, the estimate up to the cut-off date of 2 August stood at around 12,500 deaths; on 20 August the RKI reported around 14,000 for the period from 6 April to 9 August. The week of 22 to 28 June alone accounts for around 9,600 deaths by the RKI's estimate. The RKI explicitly describes its estimate as conservative and incomplete; the previous high since the series began was around 9,000 cases in 2018, and that was already exceeded in the first seven months of this year.
For municipalities, the structure of the figure matters more than its absolute size: the large majority of deaths are concentrated in a few days, and those affected are predominantly older people in inner cities, in poorly insulated buildings and in neighbourhoods without night-time cooling.
Two heat waves, two lessons
Summer 2026 had two very different phases. The June heat wave came early, was short and extreme; it hit cities whose heat-action plans, where they exist, are often only activated for July and August. The August heat was less extreme but long, and it fell in a period of pronounced drought in which urban greenery partly loses its cooling effect.
Both argue for tying heat-action plans not to calendar months but to observation data: when does the heat actually begin, which neighbourhoods fail to cool at night, and where is vegetation so dry that the planned cool places no longer work? The answers differ from city to city and from year to year.
What satellite data contributes
Thermal satellite imagery shows the surface temperature of every area of a city at the moment of overpass, by day and by night. From several acquisitions in one summer, it is possible to derive which streets, squares and building types heat up most during heat waves and where night-time cooling fails to occur. Optical data complements the picture with the condition of vegetation and the growth of sealed surfaces.
Summer 2026 provides an unusually good data basis for this: the long drought meant many cloud-free days, and the two heat phases allow a comparison between a short, extreme and a long, moderate load. Anyone evaluating these acquisitions now obtains a heat-stress map based on the actual behaviour of the city, not on model assumptions.
In practice
For a climate or public-health department, this means the winter update of the heat-action plan can build on the evaluation of this summer. Specifically, the neighbourhoods with the highest night-time heat load can be matched against the location of care homes, nurseries and the homes of older people, the sites of cool places can be checked, and the effect of unsealing or tree planting can be measured against real temperatures rather than planning targets. The data basis exists; it only needs to be evaluated.
Sources
- DWD: Deutschlandwetter im Sommer 2026 (press release, 31 Aug 2026)
- DWD: Deutschlandwetter im August 2026 (press release, 31 Aug 2026)
- DWD: Einer der wärmsten Sommer seit 1881 mit neuen Rekorden (PDF)
- prport: Bilanz des DWD – Zweitwärmster Sommer seit Aufzeichnungsbeginn
- ZDFheute: Hitzesommer 2026 war zweitwärmster seit Aufzeichnungsbeginn
- Wetterauer Zeitung: DWD-Daten zeigen – Hitzewelle 2026 hatte nie dagewesenes Ausmaß
- Cleanthinking: Hitzewelle 2026 – DWD-Bilanz mit Rekord von 41,8 Grad
- evangelisch.de / epd: RKI – Zahl der Todesfälle durch Hitze steigt weiter an (13 Aug 2026)
- Deutsche Börse / dpa: RKI geht von bislang 14.000 hitzebedingten Todesfällen aus (20 Aug 2026)
- Ärzteblatt: RKI – Zahlen zu hitzebedingten Todesfällen steigen weiter
- Berliner Zeitung: Hitzetote 2026
- Tagesspiegel: RKI-Schätzung – Tausende Tote durch Hitzewelle Ende Juni