Sentinel-3C Is in Orbit: What the New Temperature Satellite Means for Municipal Heat Planning
Since 15 September 2026, Sentinel-3C has been the third Copernicus satellite measuring surface temperature. At the same time, the BBSR half-year report shows where Germany's heat planning stands. A briefing for climate and planning departments.
A third satellite for surface temperature
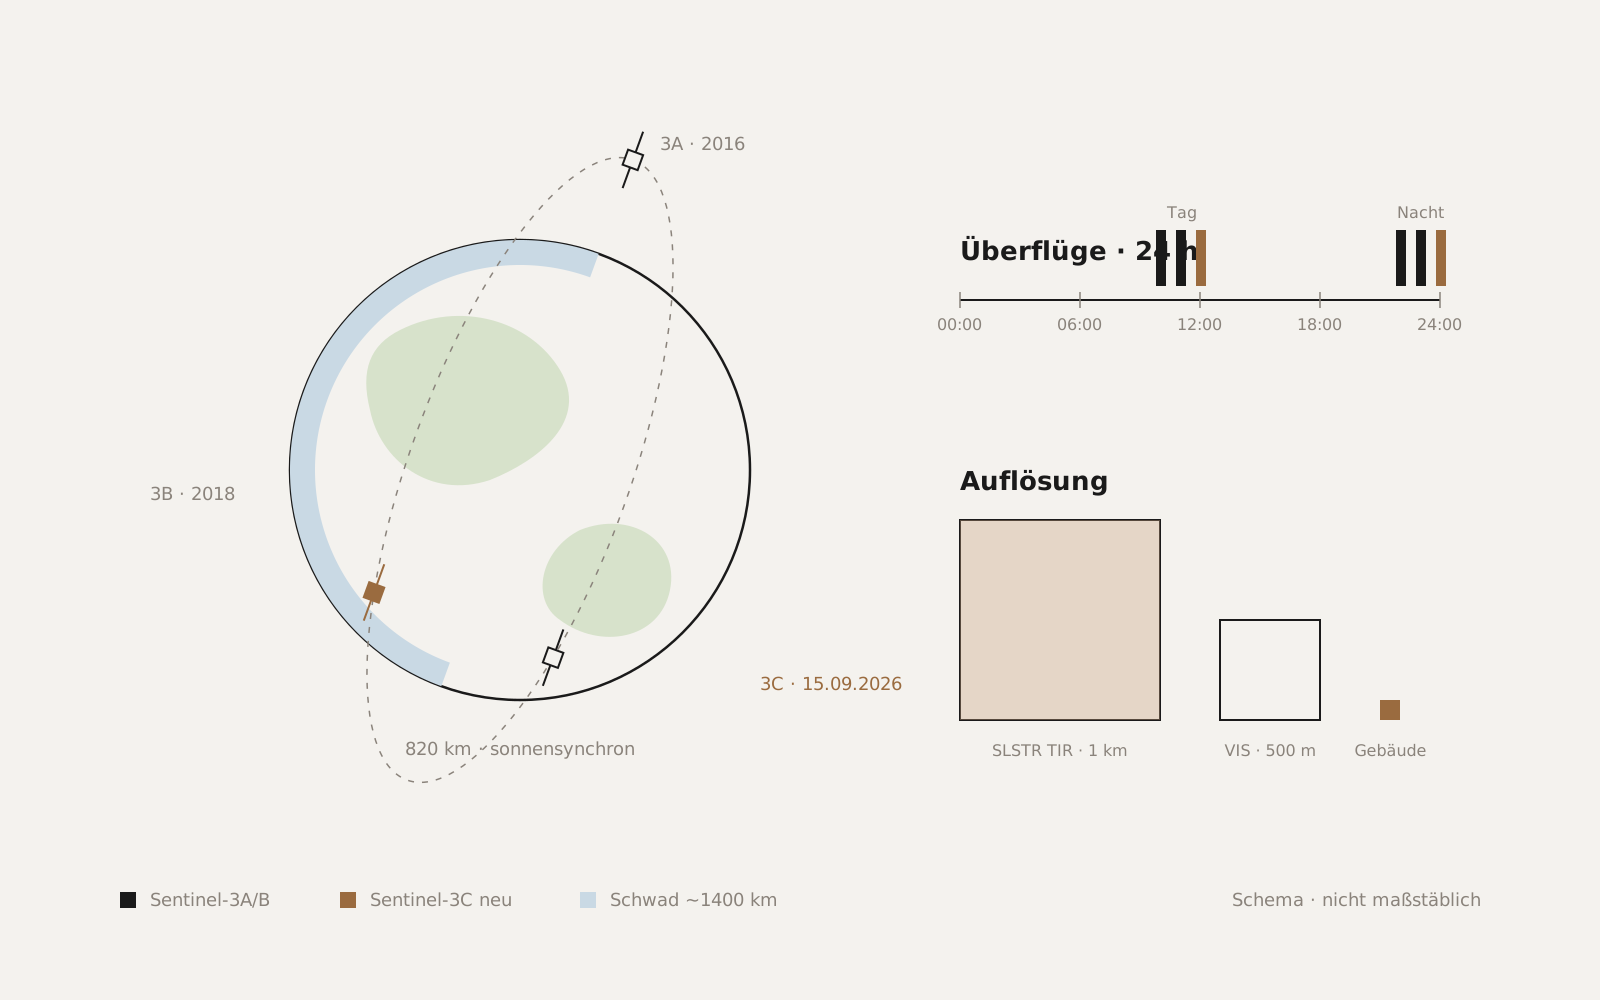
On 15 September 2026 at 03:21 CEST, Sentinel-3C lifted off from Europe's Spaceport in Kourou, French Guiana, on a Vega-C rocket. It shared the ride with ESA's FLEX Earth Explorer, which is designed to measure plant photosynthesis from orbit. Both satellites were deployed at an altitude of about 820 kilometres. Sentinel-3C joins Sentinel-3A and Sentinel-3B, in orbit since 2016 and 2018 respectively, in the Copernicus programme of the EU and ESA; the planned mission duration is seven years.
The satellite carries three instruments: the Ocean and Land Colour Instrument (OLCI), the SRAL radar altimeter and the Sea and Land Surface Temperature Radiometer (SLSTR). For municipal use, SLSTR is the sensor that matters. Its thermal infrared channels have a resolution of 1 kilometre; the visible and short-wave infrared channels resolve 500 metres. The nadir swath is roughly 1,400 kilometres wide, so the Sentinel-3 satellites together revisit any point on Earth in less than a day.
First images, thermal channels to follow
On 8 October 2026, ESA published the first images from Sentinel-3C, initially from OLCI and the radar altimeter. SLSTR delivered a first image of Hurricane Rachel on 2 October, but using its visible channels. According to EUMETSAT, the thermal images are expected shortly; the instrument is undergoing final calibration ahead of its initial data release. Anyone working with Sentinel-3 temperature data today is therefore still using 3A and 3B; 3C will be added over the coming months.
What does a third satellite add? Above all, availability and continuity. Surface temperature can only be measured from orbit under a cloud-free sky. Every additional overpass raises the chance that a usable image is actually acquired during a heat wave. And with Sentinel-3A now in its tenth year of service, 3C safeguards the data series on which many climate analyses are built.
What one kilometre resolves and what it does not
For cities, it is worth being realistic about scale. At one-kilometre pixels, SLSTR shows how a city warms relative to its surroundings in summer, how heat waves develop over weeks, and which large areas fail to cool at night. That is the right level for regional heat-action plans, for comparing urban regions, and for placing an individual summer within a long time series.
For the question of which neighbourhood, which street or which building gives off a particularly large amount of heat, one kilometre is not enough. That calls for thermal sensors with considerably finer resolution, for example from the Landsat series or from commercial providers, combined with building data. Sentinel-3 provides the large-scale context into which such detailed analyses fit; it does not replace them.
Half-time in heat planning
A look at the state of heat planning shows why thermal data is in demand right now. In its first half-year report for 2026 (BBSR-Analysen KOMPAKT 09/2026), the Federal Institute for Research on Building, Urban Affairs and Spatial Development (BBSR) evaluated the status as of 30 June 2026. By that date, 72 of the 83 large cities had completed their heat plans on time; the remaining eleven are expected to finish by the end of 2026. Nationwide, 2,836 heat plans have been completed, equivalent to 26 percent of municipalities, and 56 percent of the population now lives in a municipality with a finished plan.
Two findings from the report matter for the years ahead. First, many large-city heat plans assume an annual renovation rate of 2 percent, whereas the actual rate for residential buildings in 2025 was below 1 percent nationwide. Second, the share of district heating is meant to rise from an average of around 22 percent in the base year to almost 50 percent in the target scenarios. Both are assumptions that will have to be checked when plans are updated, and both can only be checked at all with regularly refreshed observation data.
The large cities have delivered. For the roughly 10,000 smaller municipalities, the deadline runs until 30 June 2028, and for all of them the same applies: a heat plan is not a finish line but a snapshot that will be revised.
In practice
For climate and planning departments, this means the data situation for heat is about to get better, not worse. Sentinel-3C strengthens large-scale, daily observation; high-resolution thermal data fills the gap at neighbourhood and building level. Anyone updating a heat plan or a heat-action plan can already define which indicators should be tracked year by year, such as night-time cooling of individual districts, thermal anomalies in the building stock, or the growth of sealed surfaces. The satellites to do that are now in orbit.
Sources
- ESA: Sentinel-3C returns its first views of Earth (8 Oct 2026)
- Copernicus Marine Service: Copernicus Sentinel-3C launched
- Space.com: Vega C rocket launches 2 European Earth-observing satellites
- Avio: Avio to launch Copernicus Sentinel-3C and FLEX satellites on September 14th 2026 on Vega C
- EUMETSAT: Sentinel-3C first images
- EUMETSAT: Sentinel-3 surface temperature radiometer delivers first image
- Ocean News: Sentinel-3C captures first hurricane image with surface temperature radiometer
- ESA: Sentinel-3 Instruments
- Sentinel Hub: Sentinel-3 SLSTR L1B
- BBSR: Status quo der kommunalen Wärmeplanung – 1. Halbjahresbericht 2026 (Analysen KOMPAKT 09/2026)
- pv magazine: Mehr als die Hälfte der Bevölkerung lebt in Kommunen mit abgeschlossenem Wärmeplan
- stadt+werk: Fortschritte bei der kommunalen Wärmeplanung
- GEB: Kommunen schließen Wärmepläne schneller ab